“Do what you love, and you’ll never work a day in your life.” As true as that old adage might be, doing what you love doesn’t always pay the bills — unless you carefully consider your location and cost of living in addition to your career.
That’s what our Cost & Opportunity series is all about: helping you find your perfect city. So far, we’ve calculated the best cities for renters in six occupations, taking into account job density, median wages, and median rent:
This time, we’ll delve into the best cities for renters architecture and engineering occupations. According to Bureau of Labor Statistics data, the field includes architects and engineers ranging from civil to aerospace, as well as drafters, electro-mechanical technicians, landscape architects, surveyors, and mapping technicians.
In terms of wages alone, architects and engineers in San Jose-Sunnyvale-Santa Clara, CA, are in the lead with $112,090 — nearly $14,000 ahead of the second-highest earners in San Francisco-Redwood City-South San Francisco, CA.
Four more California metropolitan statistical areas also place in the top 10 for highest architect and engineer wages: Bakersfield ($96,350), Oakland-Hayward-Berkeley ($95,710), Sacramento-Roseville-Arden-Arcade ($94,420), and Los Angeles-Long Beach-Glendale ($92,260).
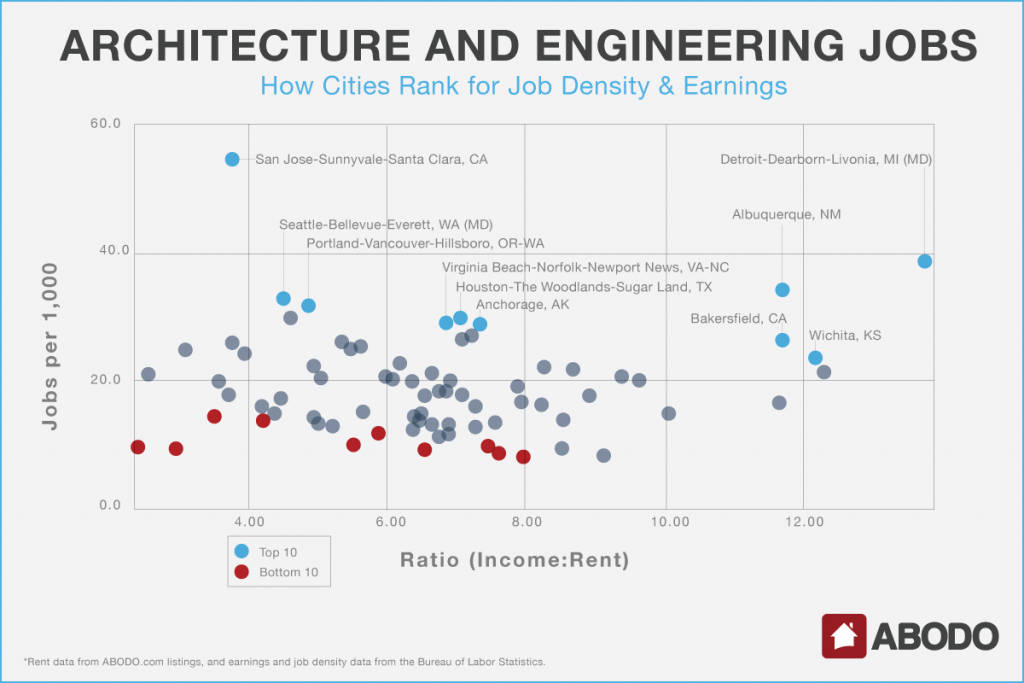
When we factor in job density — specifically, architecture and engineering jobs for every 1,000 jobs in each MSA — San Jose keeps its top spot, with 54.28 jobs per 1,000. Quite far behind San Jose, a hub of computer hardware engineers and technicians, are Detroit-Dearborn-Livonia, MI (38.66); Albuquerque, NM (33.99); Seattle-Bellevue-Everett, WA (32.65); and Portland-Vancouver-Hillsboro, OR-WA (31.71).
But we have one more factor to introduce: median one-bedroom rent prices. High rent prices pose a strong disadvantage to expensive metros in our ranking, but one that is easily overcome by a wealth of architecture and engineering jobs. To give each MSA in our ranking a composite score, we weighted the employment density 75%, and income-to-rent ratio the remaining 25%. The results?
Unsurprisingly, San Jose-Sunnyvale-Santa Clara, with the highest employment score, again retained its top spot, despite having an income-to-rent ratio of just 3.76 — the ninth-lowest of all 76 cities we examined. San Jose’s total score is 7.81 out of 10.
Detroit-Dearborn-Livonia was carried to a close second place by the best income-to-rent ratio in our study, combined with ample opportunity, for a total score of 7.47. Albuquerque (6.26) came in third, with Bakersfield, CA (5.02) and Wichita, KS (4.68) rounding out the top five.
Although few areas scored highly for architecture and engineering jobs, two MSAs stand out at the very bottom of the list: New York-Jersey City-White Plains, NY-NJ, and Miami-Miami Beach-Kendall, FL, both scored less than .4 points. New York has the lowest income-to-rent ratio (2.37), which goes unredeemed by an extremely low job density.
Miami follows similar trends, lacking both employment opportunity and affordable rents, even on an engineer’s median salary.
For press inquiries, contact Sam Radbil.
METHODOLOGY
We used 2015 data from the U.S. Bureau of Labor Statistics on employment per 1,000 jobs and median annual wages for all architecture and engineering occupations by metropolitan statistical area and paired it with Rentable data on median one-bedroom rent prices. To calculate the income-to-rent ratio for each MSA, we divided the median annual wages by 12 to get a median monthly wage, then divided the result by the current median 1-bedroom rent price for the area. We then scaled both the employment per 1,000 jobs and the income-to-rent ratio to give each a relative value between 0 and 10. The final score is a weighted sum of the scaled values, with employment per 1,000 jobs carrying a 75% weight and income-to-rent ratio 25%.