A college education — according to Center on Education and the Workforce found that from 1967 to 2007, the number of high-skill jobs requiring a college degree rose 14%, while low-skill jobs fell 10%. College graduates are not only more likely to get a job — they also make more money. Despite making up only 34% of the total workforce, college-educated workers make 53% of its earnings.
But what about student workers who are in the process of getting a college education? With rising tuition costs, meal plan prices and a stagnated minimum wage, how possible is it for today’s students to work their way through college? Is it possible for students to transform their finances at an early age?
We examined data from the U.S. Census Bureau’s 2015 American Community Survey to find the states where today’s college students are working the most and how much they’re working. Then we examined tuition, loans, and rent, to have a better idea of how working students’ earnings stack up against college costs. We also asked 3,500 working college students about their income, spending habits, and how their jobs affect their education. What results is a revealing portrait of today’s working students and the challenges they face as they put the “work” into schoolwork.
WHERE DO STUDENTS WORK THE MOST?
First, a definition. In this study, a “working student” is a student in a two- or four-year undergraduate degree-granting program who works at least 27 weeks per year. According to the Census, 52% of undergraduate college students in the United States fit the bill. And as the following map shows, the percentages of working students vary widely by state.
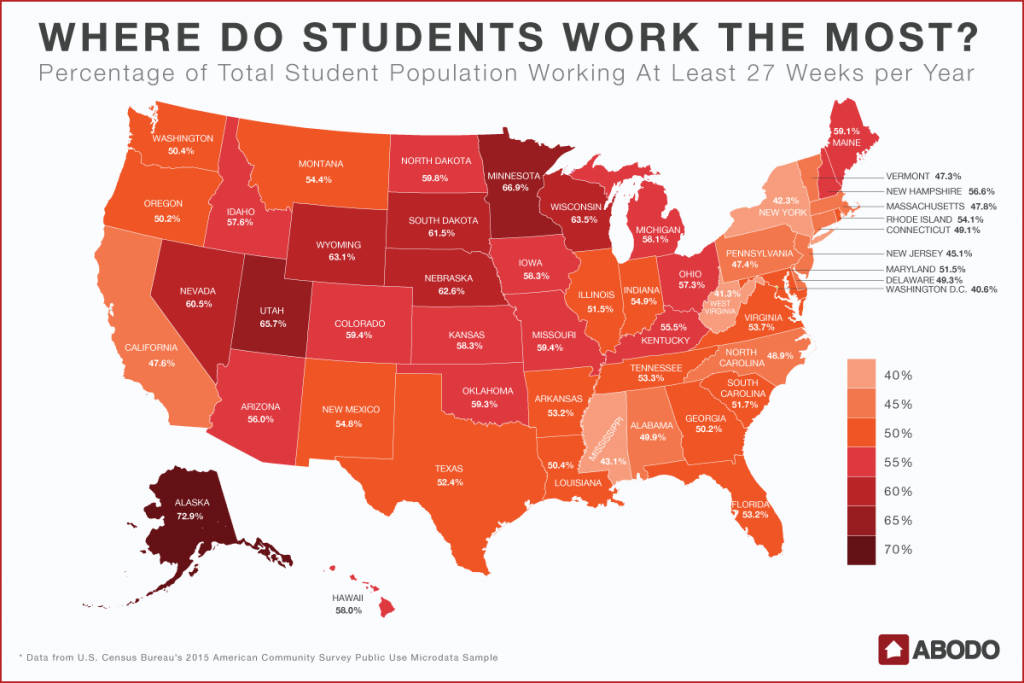
The states with the highest percentages of working students are Alaska (72.9%), Minnesota (66.9%), Utah (65.7%), Wisconsin (63.5%), and Wyoming (63.1%). The states with the lowest percentages are New Jersey (45.1%), Mississippi (43.1%), New York (42.3%), West Virginia (41.3%), and Washington, D.C. (40.6%).
In all, 38 states show a working student majority. The highest percentages of working students seem to be in the Midwest, Upper Midwest, and West. Of the 12 states where working students are the minority, nine are on the east coast.
In general, public schools show a higher percentage of working students than private schools. In 42 states, a majority of college students at public schools work; the same is true for private schools in 27 states. The differences can be stark: In Vermont, only 35.8% of undergrads at private schools work, while 58.4% of their public school counterparts hold jobs. The split is similarly wide in South Dakota, New Mexico, Massachusetts, D.C., Connecticut, and Montana.
Interestingly, in 15 states the percentage of private school students who work is higher than the figure for public school students. The discrepancy is particularly large in Wyoming, where 77.1% of private school undergrads work, compared to 61.8% at public schools.
Although the state proportions of working undergraduate students vary widely — from Alaska’s 72.9% to West Virginia’s 41.3% — the nationwide average places working students in the majority, at 51.97%. Looking at just how much these students are working gives us a little more insight into how they balance a load of courses and a weekly work commitment. The largest portion of students attending both public and private schools work between 31 and 40 hours a week.
Fewer private-school students work compared with their public-school peers; however, the hours worked are very comparable between school types. In fact, the greatest disparity between public- and private-school students is in the 1- to 10-hour range, with 5.3% of public students working those hours compared with 10.7% of private-school students.
The two student bodies even have similar overall averages: The typical working public-school student handles 31.1 hours per week, while the working private-school student averages 30.7 hours. Both of these measures are breathing down the neck of the U.S. Bureau of Labor Statistics’ definition of full-time work as 35 hours per week.
THE COST OF COLLEGE
Click to enlargeRegardless of weeks worked, or hours worked, college costs still stack up. For one year at a public university, 2013 to 2014, the average in-state student faced a $8,070 price tag. If they attended school across state lines, that number jumped to $22,603 per year. Higher yet, private schools in the U.S. charged an average annual tuition of $25,696. As steep as that is, many private schools also offer much more aid to their students. In 2012, that lead to an all-time-high tuition discount rate of 45% for private colleges, through scholarships and need-based aid.
Nationally, single-year tuition costs left students with an average of $6,891 in federal student loans, the main source of student lending.
Although it might seem like many students received less in loans than it took to afford a year of schooling, there are exceptions. Idaho, for example, had a stunningly low in-state tuition for public schools of just $5,980 (tripled to $18,875 for out-of-state students) and $6,736 for private schools, while federal student loans in the state average $6,772. Similarly, Wyoming public-university students paid just $3,642; however, private tuition came in at $16,620.
On the other end of the spectrum, students in New Hampshire paid the highest price for in-state tuition at a public university, at $14,435. Vermont out-of-staters topped the list with $33,700 in tuition, while Massachusetts, home to Harvard and MIT, brought the highest price for private schools, at $38,009. Alaska, interestingly, stacked up the most in student loan debt, with $7,496 per year, even though the state has the highest proportion of working students in the country.
The average student accrues $6,891 in federal loans per year — totalling $27,564 of debt for a four-year degree if costs and lending remain level. However, a recent Sallie Mae report found that 73% of students had no student loan borrowing, largely due to parent income, college savings plans, student income and savings, and scholarships and grants. The same report found that 31% of students managed to pay nothing at all.
Our own survey of 3,500 college students found that 11% of college students aren’t responsible for any of their college costs. For 24.8% of students, less than 25% of their college costs fall on their plate, which was the most popular response. The second most popular response is on the other end of the spectrum: 24.4% of college students are responsible for 100% of college costs.
But how is a full-time student managing to pay for any of those various, steep college costs? Most (70.2%) plan to use their own earnings and savings, 59.7% rely on scholarships, and 56.7% also plan to use loans.
AFFORDING HOUSING
“Working through college” in the sense of using earned money to pay for tuition bills as they come isn’t a real possibility for most students. Instead, for many it means using loans, scholarships, and the like to cover tuition, while using earned income to pay for things like housing, food, transportation, and other monthly bills.
In our survey of working college students, 83% of respondents said that they used their earnings to pay for food, with books (70.7%) and transportation (70.7%) following closely behind. Bills (57.7%) and tuition (50.7%) were also common uses for income, with housing (49.8%) close behind. Only 29.5% of working college students use their earnings for their cellphone bill — a surprising fact that points to the durability of the shared family plan, which seems to persist even after students go off to college.
Living in campus housing absorbs some of these costs, lumping housing and food budgets into tuition costs and effectively transferring that payment into however tuition is being paid. Others choose to continue living at home, with parents, grandparents, aunts or uncles, to keep costs low. For the majority of working students, however, the cost of freedom manifests itself in a monthly rent check.
According to Census information, the largest share of all working students (37%) choose to stay with parents, while 33.6% rent. Another 19.3% identify as owners, and just 8.4% sign up for dorm life.
If we look at all students, not just those working, the percentage living in dorms nearly doubles to 14.2%, and the percentage living with parents also soars to 41.2%, while the percentage renting shrinks to 28.3% and owners is down to 14.2%.
Ages are closely linked with the students’ living situations, regardless of working status. Those who live in the dorms tend to be the youngest group, with an average age of around 19, and those living with parents tend to be a little older, around 22. Renting students, on the other hand, averaged 27 years old, while owners were about a decade older, around 37 — likely nontraditional or returning students.
That said, the largest group of working students not living with their parents are renting, so let’s take a closer look at their likely rent-to-income ratio.
Nationally, the the median income for working undergrads is $14,383. And on average, rent costs 41.6% of that amount. That means the average working college student falls under the U.S. Department of Housing and Urban Development’s definition of a cost-burdened renter: spending more than 30% of income on housing. Breaking it down state by state reinforces the reality for many students: The average renting undergrad is cost-burdened in 49 states, and Washington D.C.
Housing affordability is an especially acute issue in Washington D.C., with the working undergraduate earning a median of just $9,698 and housing costing an average of 59.3% of that income. Alaska had the highest student median income, with $27,406, and housing costing an average of 29.5%, the lowest income to housing cost ratio of any state. Vermont had the lowest median income for students, at $8,053 per year, and rent was on average 46% of that total.
Students faced with rent costs beyond 100% of their income are capped at 101% in the Census’ data, meaning many of these state averages would potentially be higher yet if there was more precise data for these households.
WORKING STUDENT EXPERIENCE
Although we can’t say who is paying for their own rent, we can still clearly see the realities working students face: 31 hours of work per week plus class time and homework, earning just $14,383 per year and spending nearly 42% of it on rent, while the loans stack up to the tune of $1.3 trillion in unpaid student loans nationwide. That amount is expected to double by 2025, Bloomberg reports.
We asked the students how working impacted their studies, and their reflections on their jobs were largely positive. The largest group, 34.9%, said it made them take college more seriously, 27.6% said it made school more difficult, but their grades were still good. Just 20.5% guessed their grades would have been higher if they hadn’t needed to balance a work schedule with their studies, while 16.3% said it had no substantial effect, and .6% said that it ruined their college experience.
Piling work hours on top of hours spent studying and spent in class is bound to add stress, but as the students themselves report, it’s a motivator to keep on top of schoolwork and to keep an eye on your future.
CONCLUSION
So how possible is it to work your way through college?
Depends on your definition. If our data is any indication, it is very possible to work while in college — in fact, in most of the country, the majority of college students are also workers. But that doesn’t mean that their earnings are in line with their college costs — which, in an era when tuitions regularly exceed $40,000 per year, would be almost impossible.
Instead, today’s working students face the challenges of rising tuitions and rents by focusing on the immediate: food, books, transportation, and bills. If it hasn’t been at least partly subsidized by scholarships or family help, the cost of going to class has been pushed to the future in the form of student loans. Working students can find themselves working to pay for college long after graduation day — a burden that can have an enormous impact on a student’s planned course of study, and which disproportionately affects lower-income students.
For press inquiries, contact Sam Radbil.
Are/were you responsible for paying for your own #college? |
— Rentable Apartments (@rentableapts) May 31, 2017
METHODOLOGY
We analyzed the U.S. Census Bureau’s 2015 American Community Survey public use microdata sample (PUMS), merging the household data set and individual person dataset. Each PUMS record includes a person weight and a household weight assigned by the Census Bureau for calculating estimates. Further information on this weighting can be found in the PUMS documentation.
As the base for our calculations we used the subset of records in which the respondent listed “undergraduate student” as their current grade in school. We defined a “working student” as an undergraduate working at least 27 weeks in the previous 12 months. All percentages in this analysis were calculated as the sum of the weights of respondents with a given characteristic, divided by the sum of the weights of respondents in the base. For example, the percentage of students working equals the sum of weights of working students divided by the sum of weights of all students.
Living Arrangements
We categorized the students’ living arrangements based on their relation to the reference person (householder) in the housing unit. Students who listed “child (biological, step, adoptive, foster, grand, or in-law)” as their relation were considered to be living with parents; those who listed their relation as “self, spouse, roommate, sibling, or other non-relative” were considered independent and were further broken down by tenure to form the renter and owner categories; those living in noninstitutionalized group quarters were considered living in dorms. The “other” category comprises those who listed their relation as “parent,” “parent-in-law,” “other relative,” or “institutionalized group quarters.”
Median Income & Rent
To calculate median income, we created weighted frequency distributions for the inflation-adjusted wage of working students in each state. We then used the design factor method provided in the PUMS documentation to calculate estimates of the medians. “Percentage of income spent on rent” is a statistic listed in each PUMS household record. We calculated the average by state (as a weighted average using household weights) for the population of working-student renters.
Rentable was designed to help students of all backgrounds find apartments that suit their needs. We’ve helped Buckeyes find an apartment near Ohio State and showed Badgers off-campus housing close to UW-Madison. We know where the most affordable rentals near Pitt are, how to find a cheap apartment close to UW-Milwaukee, and if you’re in Minneapolis, we can help you find the perfect apartment in Dinkytown. Wherever you are, we know where to rent.