NOTE: This report is outdated. Please find our 2020 Annual Rent Report here.
Despite a still-strong economy, one-bedroom US average rent prices decreased by 2.01 percent, while two-bedroom prices were virtually flat at with a slight 0.08 percent gain.
2018 continued 2017’s trend of uncertainty, and as political controversies intensified, an unsettled feeling permeated the United States. Fires raged in California, Texans had to boil water for days because of floods, and the stock market began to look precarious.
Many readers probably do not remember the days of near-hyperinflation that plagued the U.S. during the 1970s, and they may wonder why some amount of inflation is desired. The Federal Reserve (the Fed) feels that a two percent inflation rate—in other words a situation where yearly prices increase by two percent—is healthy. A higher inflation number can signal an overheating economy, and that can lead to higher apartment rental prices.
In order to keep the inflation rate manageable, the Fed uses interest rates as tools to kindle or fight inflation. During 2018, the Fed finally began to raise interest rates, and this has begun to affect the housing market as reported by U.S. News and World Report:
“The most common topic of conversation for potential homebuyers and sellers going into the new year (2019) is about rising interest rates. Mortgage rates are at their highest mark since 2011, and while higher interest rates are a sign of a good economy – especially compared with historically low unemployment rates – the change has many consumers hesitating about jumping into the housing market.”
Therefore, it is very interesting to note that even though many consumers are turning away from home ownership, the rental market has not moved significantly on average.
In an effort to give renters (and potential renters) market information in close to real time, Rentable releases monthly reports on rental trends throughout the year. Our Annual Rent Report is a more zoomed-out look at the year in renting.
How did rent prices change nationally? At the state level?
Where did rent increase the most over 2018, and where did it decline?
Where are the 10 most expensive rental markets?
Let’s start with a look at what happened nationwide.
Median Rent Nationwide
Nationally, one and two-bedroom 2018 rents were mixed over the year’s course. The national median rent for one-bedrooms fell 2.01 percent, ending the year at $1,025. Rents for two-bedroom apartments stood at $1,255 in December, only one dollar more than they were in January.

Rental rates that looked unexciting in January initiated a slow decline in February. By June, the decline became more pronounced as one-bedrooms fell by almost 4 percent to $1,005. Two-bedrooms also posted their peak weakness in June losing 2.71 percent at $1,220.
By year-end, one-bedroom units settled at $1,025, off 2.01 percent for the year while two-bedrooms flattened considerably with a statistically insignificant gain of 0.08.
Rent Report by State
Rent went up in 29 states last year, including the District of Columbia. It decreased in 22 states and stayed the same in just one: South Dakota.
The states where rent fell most were Wyoming, where rent fell an average of 3.53 percent, followed by West Virginia with a loss of 3.51 percent.
The states with the highest average rental hikes were Nevada, where rents rose an average of 3.0 percent, and New Mexico with a 1.94 percent rise.
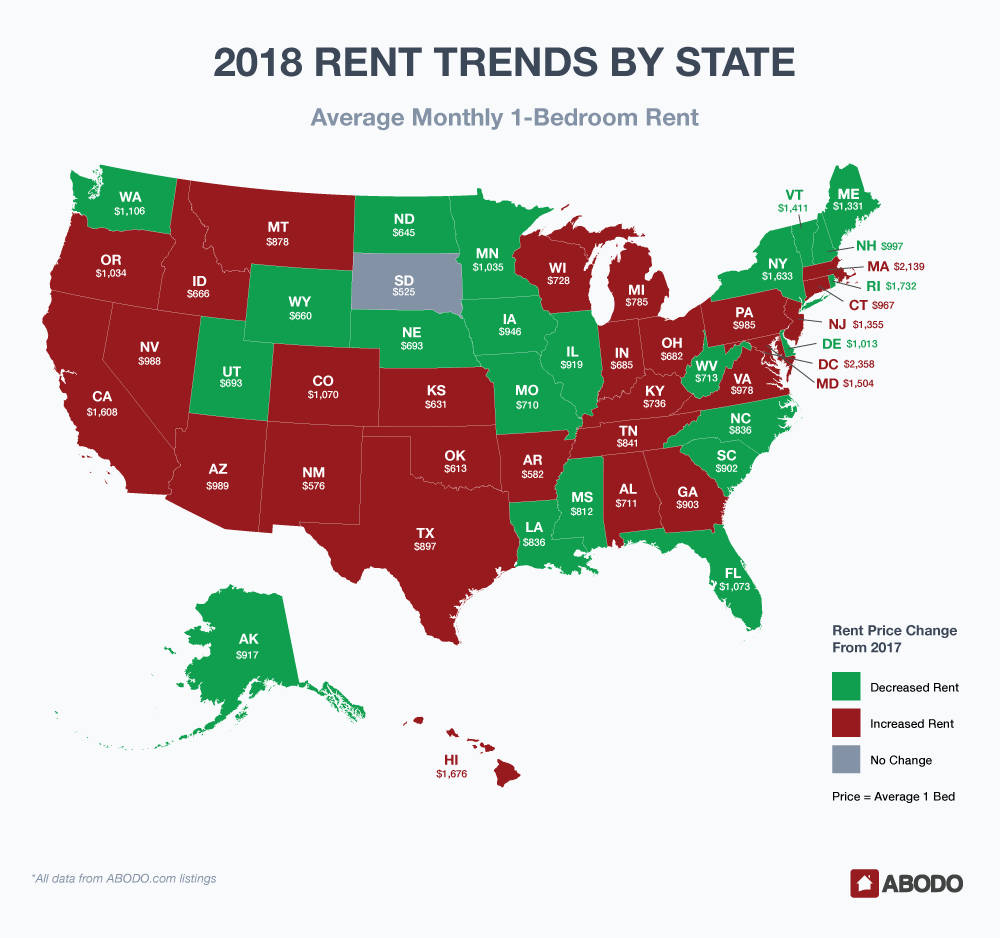
The vast majority — 45 states — saw their monthly average rent fluctuation stay within 2% of the previous year’s value.
The states with the highest rents were all on the coasts (or in the Pacific). Washington, D.C., again tops the nation, with an average rent of $2,358, followed by Massachusetts at $2,139, Rhode Island at $1,732, Hawaii at $1,676, and New York at $1,633.
If you’re looking for low rents, head for the Plains or the Southwest. With an average rent of $525 per month, South Dakota once again took the crown for the nation’s lowest rent. New Mexico, $576, Arkansas, $582, and Oklahoma at $613 weren’t far behind.
Aside from South Dakota, where monthly changes were flat, many of these states saw their rents decrease month to month, on average.
Rent Report: Greatest Monthly Rent Changes
Looking at statewide and national rental data gives us a good idea of what trends renters around the country are seeing. But if we take a closer look city-by-city and by apartment type, a more diverse set of trends emerge.
One tendency, however, remains the same: Rent increases outpace the decreases, but not by a great amount.
1-Bedroom Apartments
The 2018 yearly increase winner was Las Vegas, NV, with an average monthly increase of a healthy 4.9 percent followed by Dayton OH, at $733 and an average monthly rise of 4.77 percent. Milwaukee, WI was a 2018 hotspot posting a 3.61 percent average increase and Scottsdale, AZ reported 3.2 percent average rise. Los Angeles, CA led the less impressive increase list with a reported 2.96 percent, and expensive San Francisco with a whopping 2018 one-bedroom average rent of $3,535 rounded out the list at 1.36 percent.
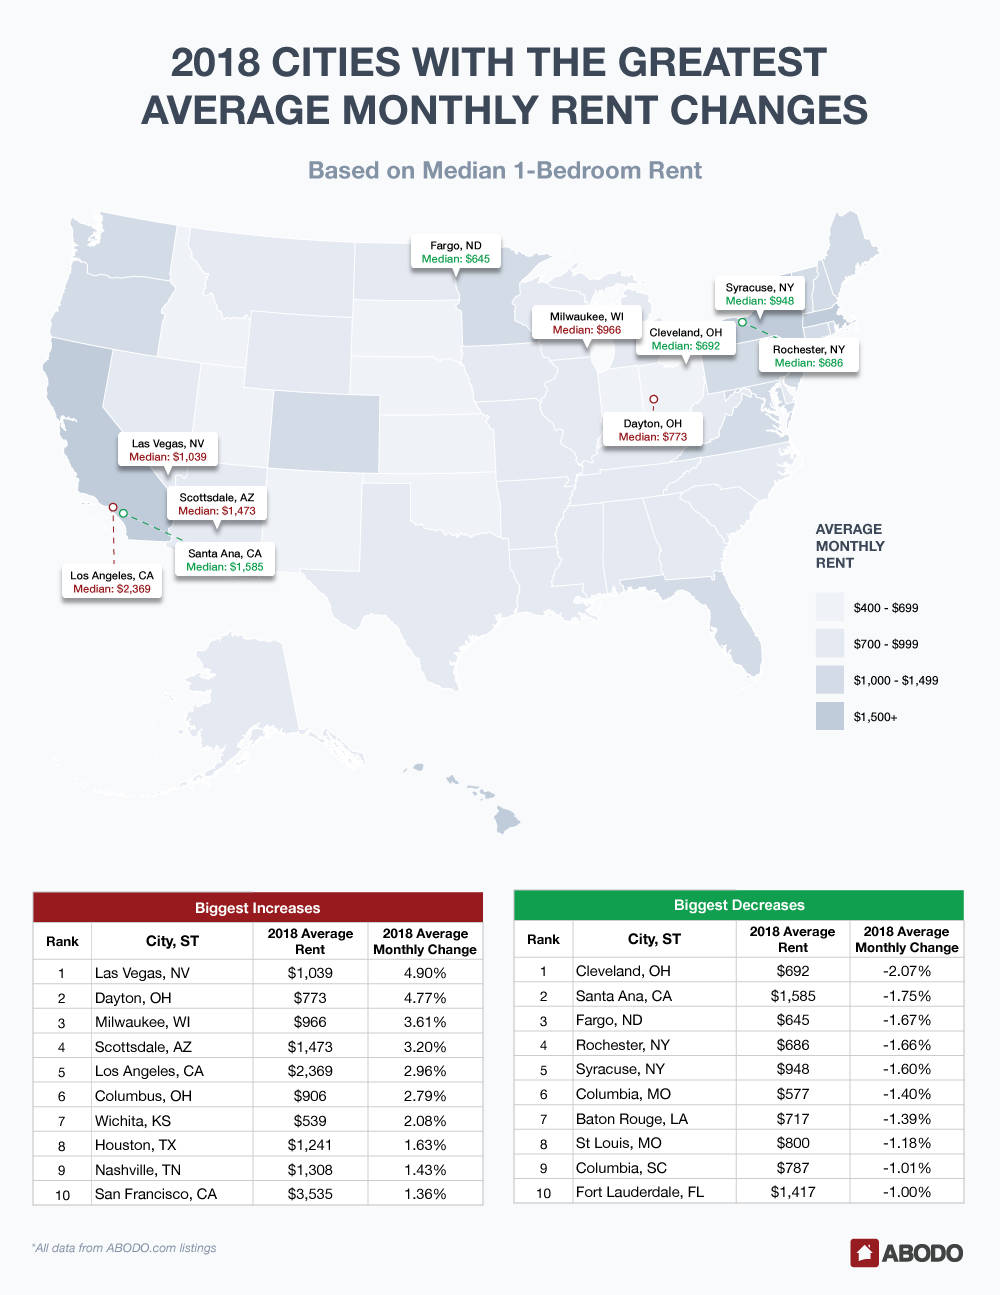
Cleveland, OH was the biggest loser with a decline of 2.07 percent with Santa Ana, CA not too far behind falling 1.75 percent to $1569. Fargo, ND lost just 1.67 percent in 2018, and Fort Lauderdale, FL declined by an even 1 percent.
2-Bedroom Apartments
Little Rock, AK won the prize for two-bedroom unit gainers with an eye-popping 7.28 percent average rise during 2018. Scottsdale, AZ and Las Vegas, NV were the two closest increasers at 5.55 percent and 4.57 percent respectively. Dayton, OH rose by 3.38 percent, and Long Beach, CA gained a similar 3.31 percent to a pricey $2,123.Los Angeles, Ca, and Atlanta reported average monthly rent changes of 2.9 and 2.09 percent respectively, and Milwaukee, WI, Houston, TX, and Tampa FL rounded out the top 10 greatest average monthly increasers with gains between 1.48 and 1.86 percent.
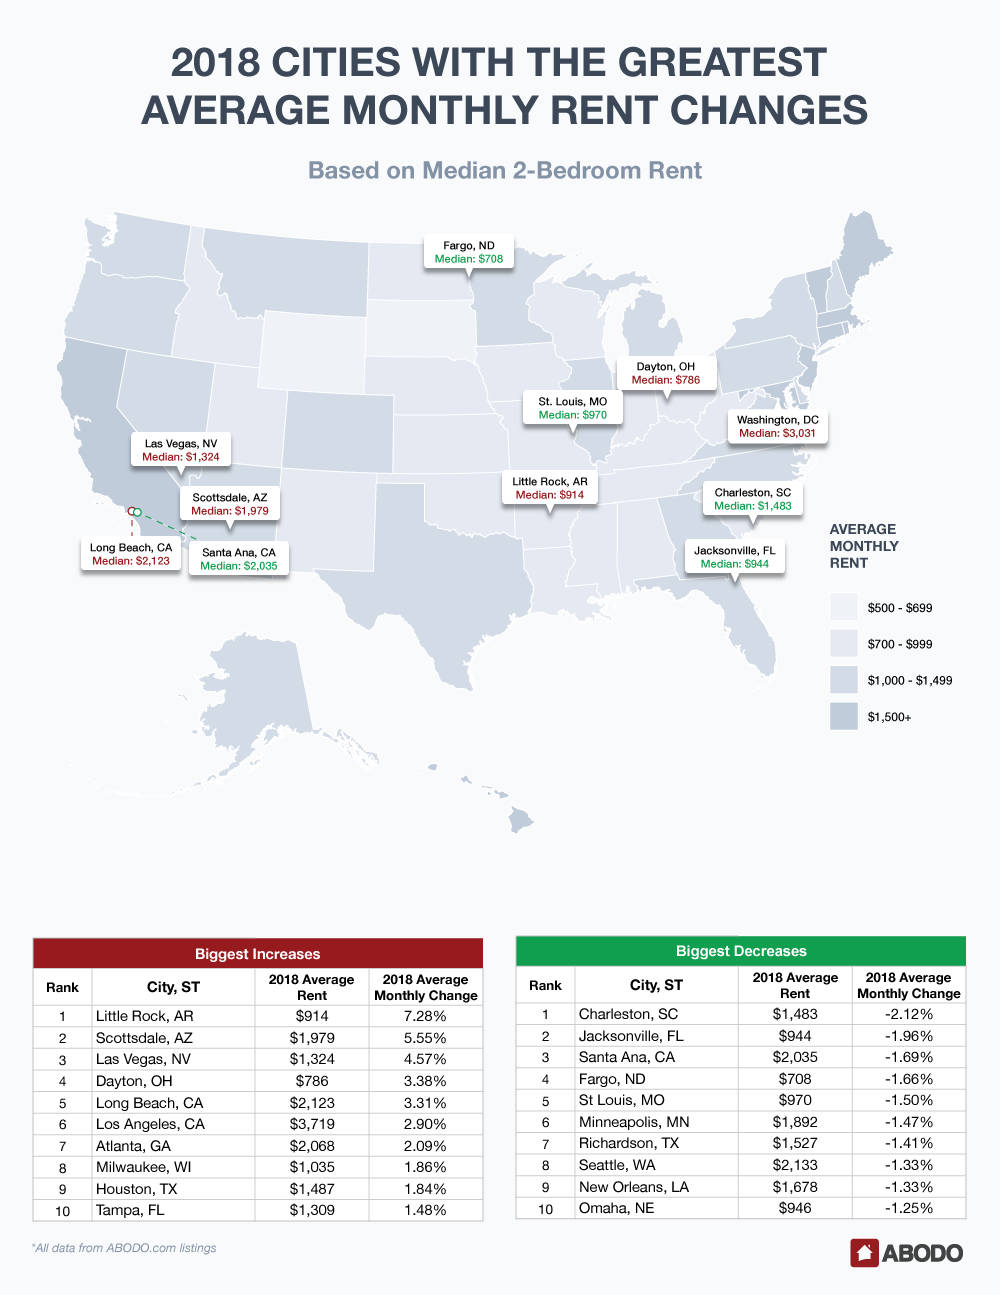
Significant two-bedroom average monthly decliners were led by Charleston, SC with a monthly average loss of 2.12 percent followed by Jacksonville, FL with a 1.96 percent decline. Santa Ana, CA and Fargo, ND posted almost identical average monthly losses around 1.60 percent, and St Louis held the number five spot with a fall of 1.5 percent per month on average. Minneapolis, MN, Richardson, TX, Seattle, WA, The Big Easy, New Orleans, LA and Omaha, NE all reported very similar average monthly losses ranging from 1.25 to 1.47 percent.
Highest & Lowest Rents in the Country
Perennial winner of the most expensive place to live award San Francisco, CA held its coveted spot with an average monthly gain of 1.36 percent reflecting a crazy-high rent of $3,535. New York, NY was second posting a modest .79 average monthly increase but a formidable $2,895 rent. Cambridge, MA was third at $2614, and four California cities, Berkeley, Los Angeles, San Jose, and Oakland claimed their spots in the top ten with rents ranging from $1,960 to $2,449. While expensive Miami came in with a rent of $1,831, the month average increases were small at 0.23 percent.
If you want to live cheaply, go to Springfield, MO where you can rent an apartment for only $503 per month. In fact, the most expensive of the top ten most reasonable United States apartments was Little Rock, AK, and the average price there is only $626.
The biggest mover of the group was Wichita, KS that showed a 2.08 percent average monthly increase but at a very affordable $539 per month.
January 2019 Rent Report: Same Thing, Different Year?
2018 turned out to be relatively flat with of course some outliers, and January so far does not show many surprises.
As of this writing, the Fed has indeed raised interest rates another .25%, and that may contribute to slower growth in 2019, and that may translate to another year of flat rental prices.
We are concerned that with slowing home ownership, however, there may be more demand for rentals, and that could drive prices upward. Let’s look, then, about the early 2019 results.
1-Bedroom January Rents
The biggest January gainer was Savannah, GA with a 9.8 percent rise to $974. Nashville, TN, Long Beach, CA and St. Petersburg, FL were next with respective gains of 6.8, 6.5, and 6.3 percent.
The rest of the top 10 January 2019 increasers were bunched in the 5 to 5.8 percent range.
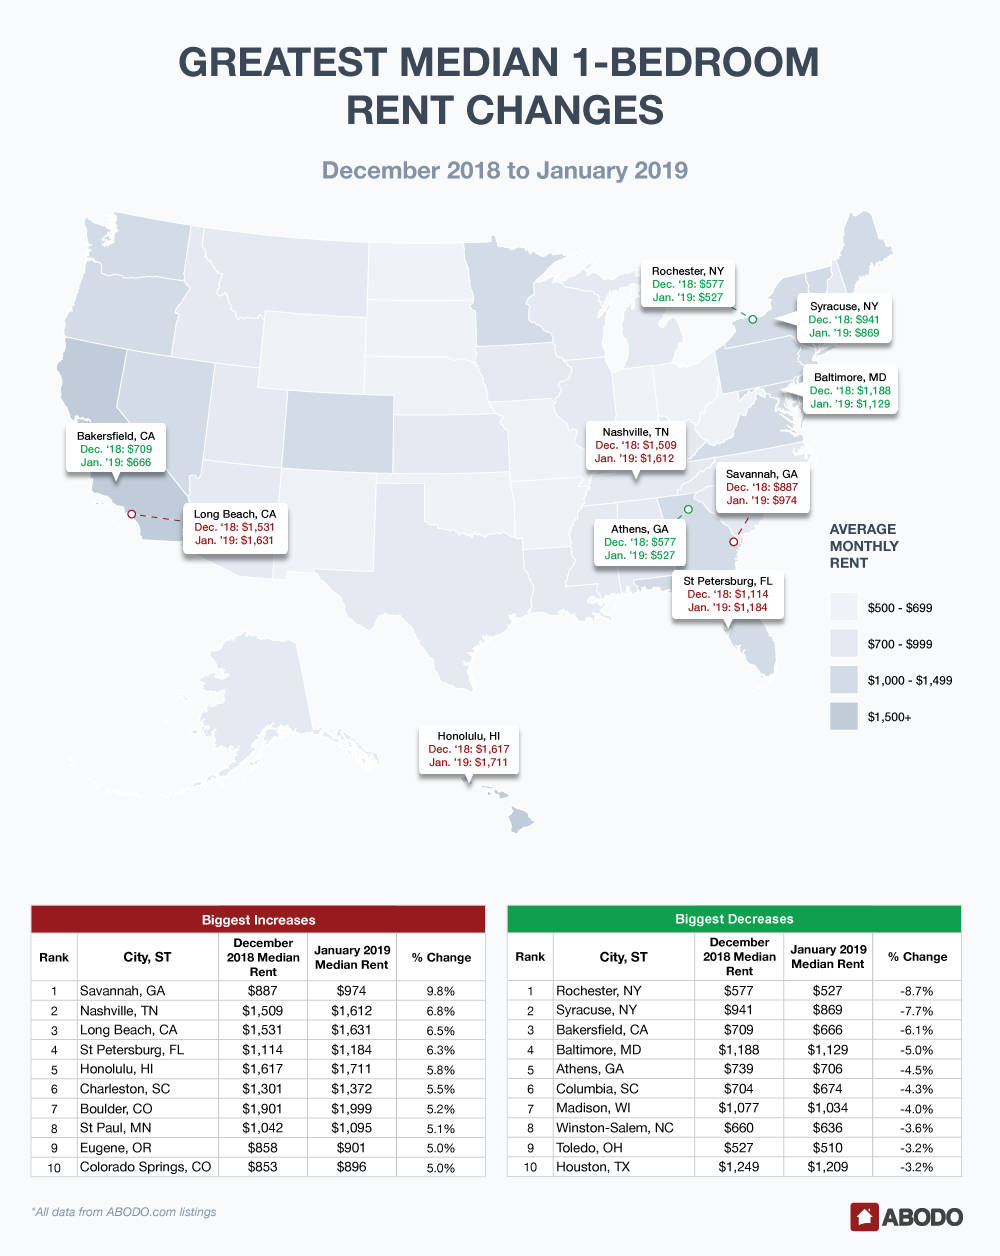
The biggest January loser was cheap Rochester, NY as it became even less expensive with a big 8.7 percent loss to a January median rent of $527. Syracuse, NY was next with a 7.7 percent loss, and on the other side of the country, Bakersfield, CA lost 6.1 percent to $666.
In the middle of the pack, Madison, WI lost a significant 4.0 percent to $1,034, and Athens, GA fell 4.5 percent to a very reasonable $706. Houston, TX was at the bottom of the loser list with a modest 3.2 percent fall to $1209.
2-Bedroom January Rents
Nashville, TN by far was the biggest gainer with a solid 11 percent increase making Music City an expensive two-bedroom city at $1,904. Athens, GA was up 9.0 percent to $1005, and Gainesville, FL rose 7.7 percent to $968 — still decent for a college town.
Santa Ana, CA, Milwaukee, WI, Fargo, ND, Denver, CO, Eugene, OR and warm El Paso, TX all reported similar increases in the 5 to 5.6 percent range. And number 10 Colorado Springs, CO gained just under 5 percent at 4.8.
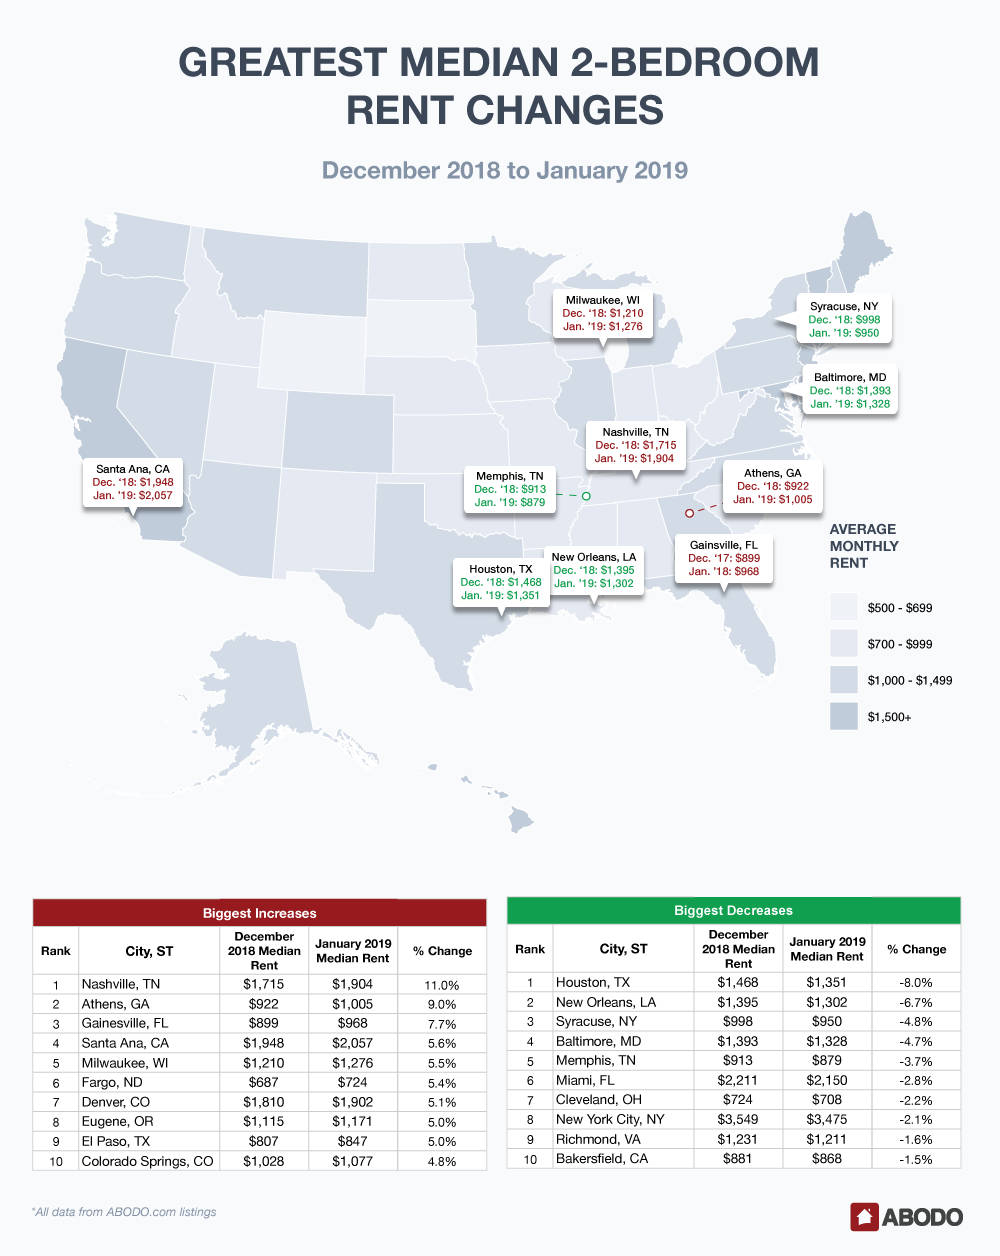
Houston, TX seemed to follow the price of crude as it lost 8.0 percent in January to $1,351. New Orleans fell 6.7 percent while Syracuse, NY and Baltimore, MD were almost tied for third place in the two-bedroom losers list with losses of 4.8 and 4.7 percent.
Memphis, TN was alone in the three percent range with a loss of 3.7 percent, and Miami, FL, Cleveland, OH and New York City, NY lost between 2.1 to 2.8 percent.
Richmond, VA and Bakersfield, CA rounded out the top 10 losers with small declines of 1.6 and 1.5 percent.
2018 started out on the mild side and although we are seeing some hotspots like Nashville, TN and Savannah, GA, we’re not looking for sky-high 2019 rental prices—at least not yet.
For press inquiries, please contact Sam Radbil.
Methodology
Each month, using over 1 million Rentable listings across the United States, we calculate the median 1-bedroom and 2-bedroom rent price by city, state, and nation and track the month-over-month percent change. For this report, we analyzed this data for the entire year of 2018 and found the average of the monthly percent changes in list price separately for each state and city. We also calculated the 2018 average list price in each state by taking the average of all monthly average list prices.
Due to small sample sizes, we restricted our city-level analysis to cities meeting minimum population and property count thresholds.