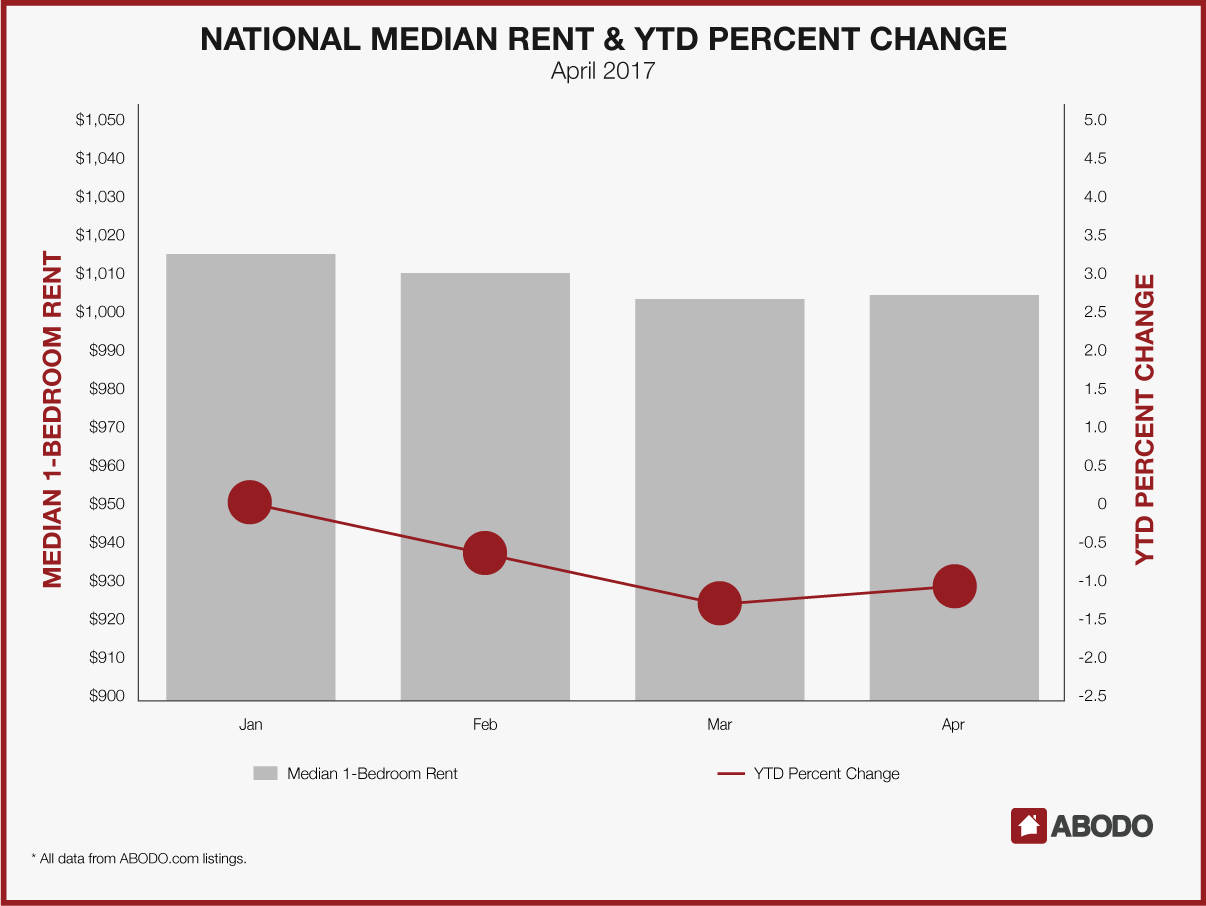
Rent prices nationwide rose throughout March — but only by about $2, or .2%, up to a median price of $1,005 for a one-bedroom apartment. The slight increase adds a hiccup to the overall year-to-date change, which was trending downward by 1.28% as of March. For April, national rents are down just 1.08% since January.
For New Orleans, LA, this marks the third straight month for having one of the 10 largest rent increases in the country — and for the past two months, the Big Easy has been in the No. 1 spot. In March, median one-bedroom rents rose nearly 12%, up to $1,180. But that’s not the only repeat appearance on the list.
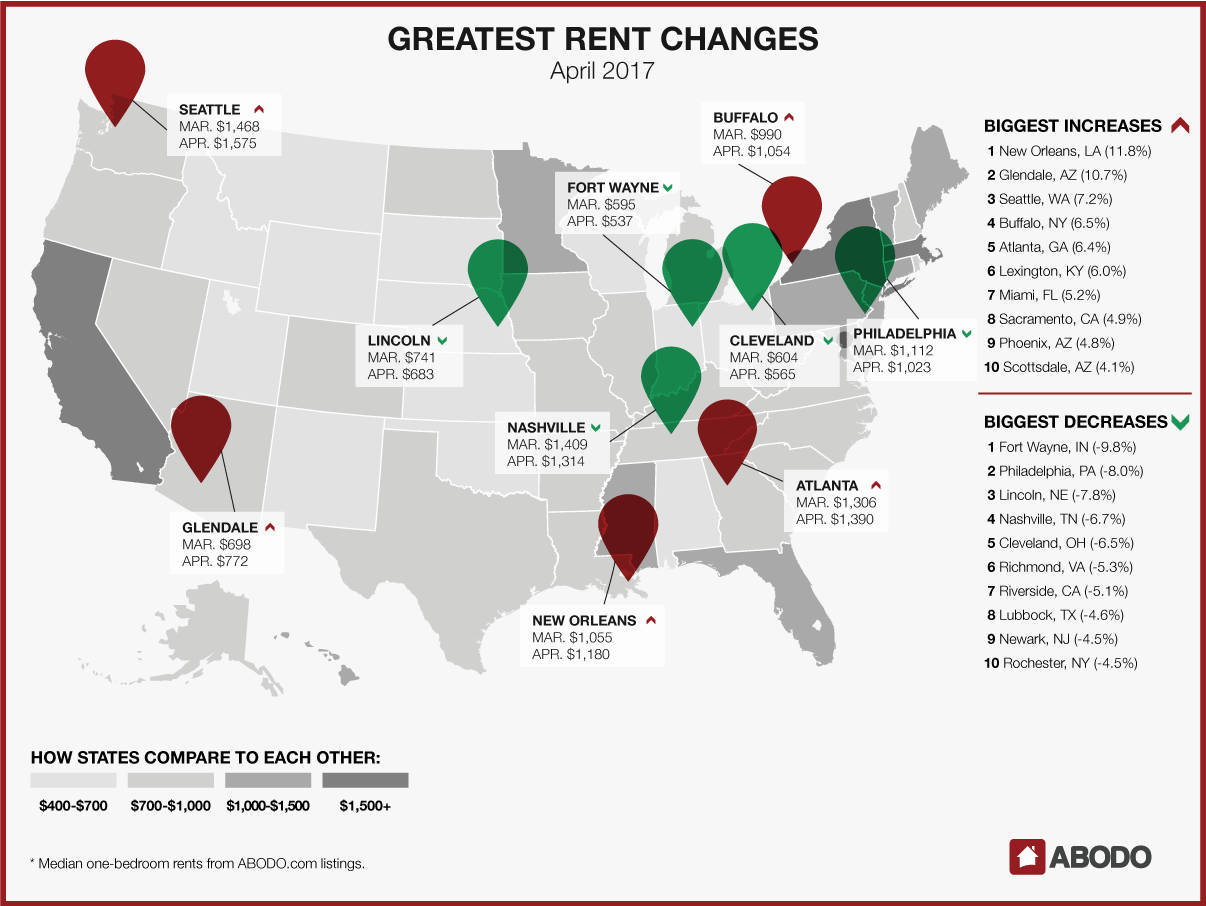
As the year continues, several other cities have established a consistent pattern of rises. In fact, six of our top 10 risers for April are carry-overs from the March report. In addition to New Orleans, Glendale, AZ (10.7%); Seattle, WA (7.2%); Buffalo, NY (6.5%); Miami, FL (5.2%); and Phoenix, AZ (4.8%), are also in their second or third month of increases.
Lexington, KY (6%); Scottsdale, AZ (4.1%); and Sacramento, CA (4.9%), also saw some of the highest rent hikes.
Meanwhile, the list of top April decreases is also fairly consistent: Philadelphia, PA, is enjoying a three-month downward trend, with a median rent of $1,023, down 8% since the March report. Fort Wayne, IN (-9.8%); Rochester, NY (-4.5%); Nashville, TN (-6.7%); Cleveland, OH (-6.5%); and Richmond, VA (-5.3%) also saw their rents go down.
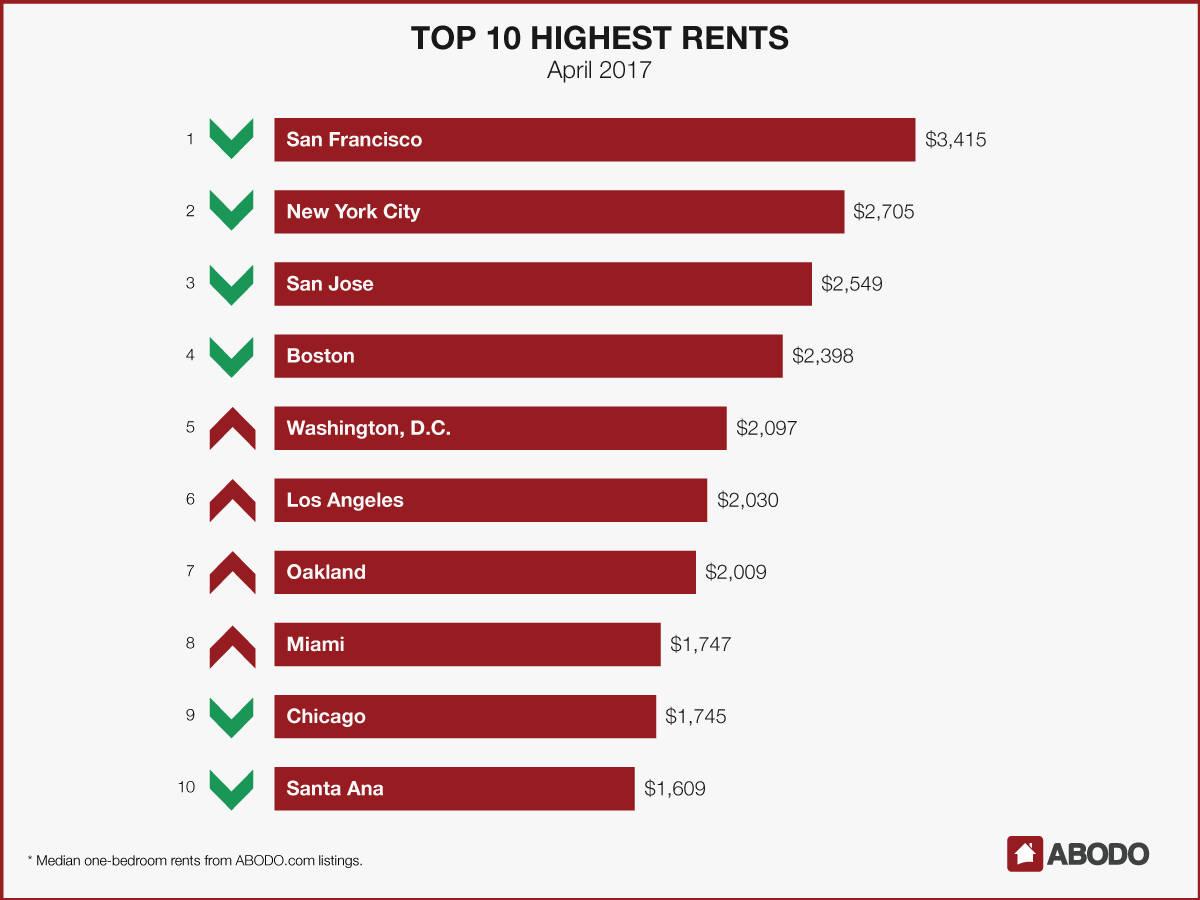
And the continuity… continues. For the cities with the most expensive rents, the list remains unchanged from March to April, save for Miami ($1,747) and Chicago ($1,745) swapping positions. San Francisco dominates the list, with a median one-bedroom rent of $3,415, which is actually slightly down from its March number of $3,465.
For press inquiries, contact Sam Radbil.
METHODOLOGY
Each month, using over 1 million Rentable listings across the United States, we calculate the median 1-bedroom rent price by city, state, and nation and track the month-over-month percent change. To avoid small sample sizes, we restrict the analysis for our reports to cities meeting minimum population and property count thresholds.