After falling through the first quarter, the national median rent has stabilized in recent months, climbing in September to its highest point of 2017: $1,018.

That means that the national median rent has increased .2% over the course of the year from January’s mark of $1,016.
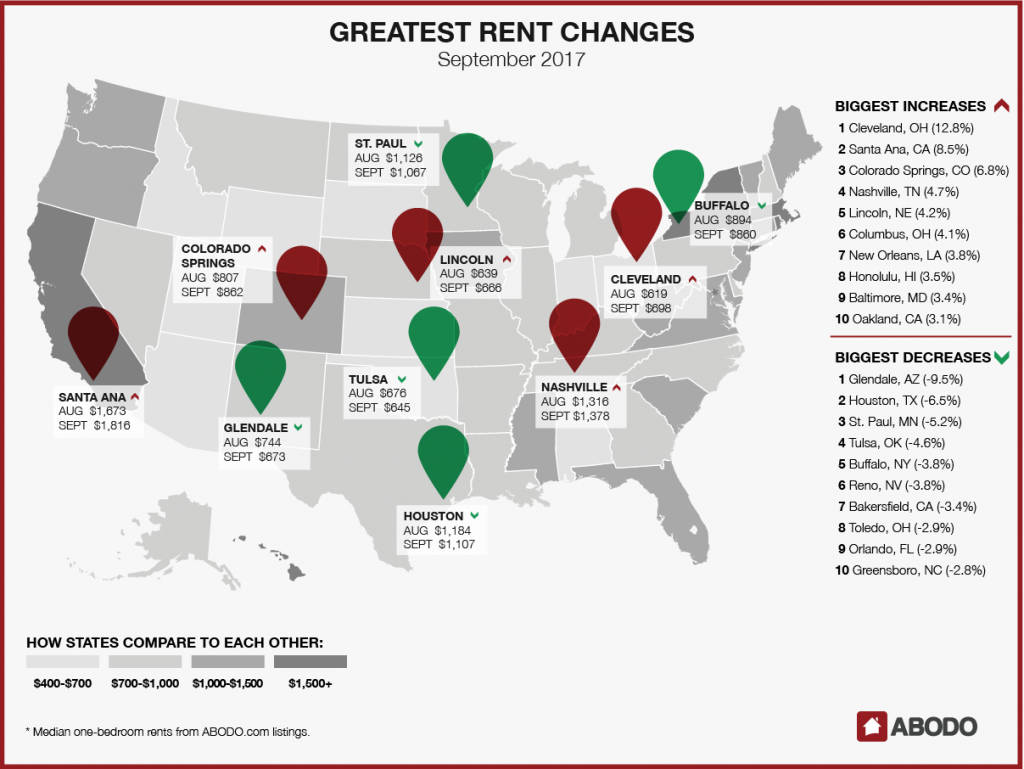
Cleveland, OH, experienced the greatest rent hike in the country over the month of August, with median one-bedroom rents jumping 12.8%, from $619 to $698. This is the second straight month of significant upticks in Cleveland, after July saw rents increase 5%. Santa Ana, CA also rose for the second-straight month, from $1,673 to $1,816 (8.5%), as did Columbus, OH (4.1%); Honolulu, HI (3.5%); and Baltimore, MD (3.4%).
The list of cities with the biggest rent decreases is also home to some familiar faces. For the second month in a row, Glendale, AZ, takes the crown, with rents dropping 9.5% to $673. St. Paul, MN, dropped 5.2%, to $1,067. Tulsa, OK (-4.6%), and Buffalo, NY (-3.8%), also reprised their places in the nation’s top five rental decreases. The only newcomer to that esteemed company? Houston, TX, where the median one-bedroom price dropped 6.5%, from $1,184 to $1,107.
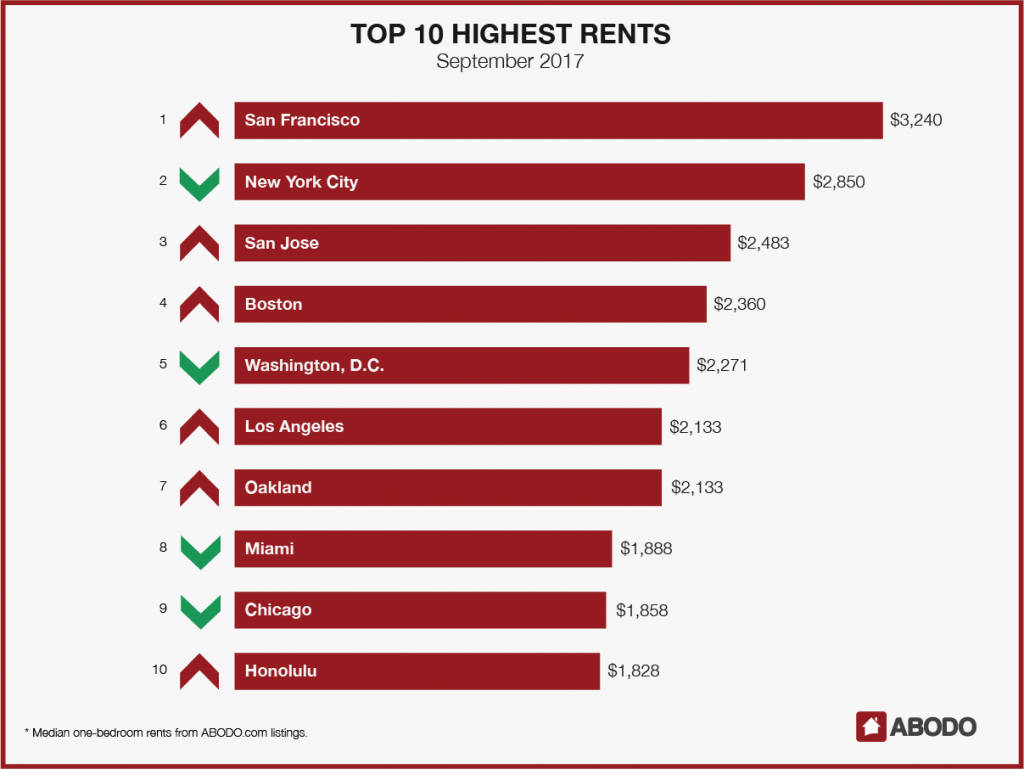
The list of the nation’s highest rents is identical to last month’s list. San Francisco, CA, still leads the way, with a one-bedroom median rent of $3,240, up $30 from August’s report. New York City, NY, saw rents drop $57 but still comes in at #2 on the list, with a median rent of $2,850. And San Jose, CA, where rents increased to $2,483, retains its place at #3. Of the remaining seven cities with the highest rents, four saw increases over the month of August.
For press inquiries, please contact Sam Radbil.
METHODOLOGY
Each month, using over 1 million Rentable listings across the United States, we calculate the median 1-bedroom rent price by city, state, and nation and track the month-over-month percent change. To avoid small sample sizes, we restrict the analysis for our reports to cities meeting minimum population and property count thresholds.