How many construction sites do you pass each day? What percentage do you think are “green construction” sites?
Probably at least one — and if you’re in a fast-growing metropolis like Seattle, probably more than you’d care to keep track of. For most cities, growth is a perpetual goal, and all of that growth, both economic and in population, eats up a lot of space.
In July 2017 alone, the U.S. Census Bureau reports that 1.2 million residential building permits were issued, 1.16 million housing projects were started, and 1.18 million housing projects were completed.
What is the impact of producing and transporting materials for so many projects? How will new buildings affect the local environment? How much energy do they require? As concerns about human impact on climate change grow, so does interest in sustainable building practices.
The U.S. Green Building Council developed the Leadership in Energy and Environmental Design (LEED) certification to provide a framework for businesses and organizations with an eye for sustainability. From concept to conception, LEED certification standards reduce the carbon footprint, energy costs, and overall negative environmental impacts of commercial and residential building projects.
LEED certification currently comprises about 40% of green construction’s contribution to the economy, according to the USGBC’s Leticia McCadden, and by 2018, LEED is expected to directly contribute nearly $30 million to the nation’s GDP. A 2016 study by Dodge Data and Analytics projected that green building around the globe doubles every three years.
OVERVIEW OF RESIDENTIAL LEED CONSTRUCTION TODAY
Even if you’ve never heard of LEED certification, or any sustainable building practices, it’s all around you, to the tune of 1,318,730,894 residential square feet. That’s enough to cover about 89% of Staten Island, or about 23,000 football fields.
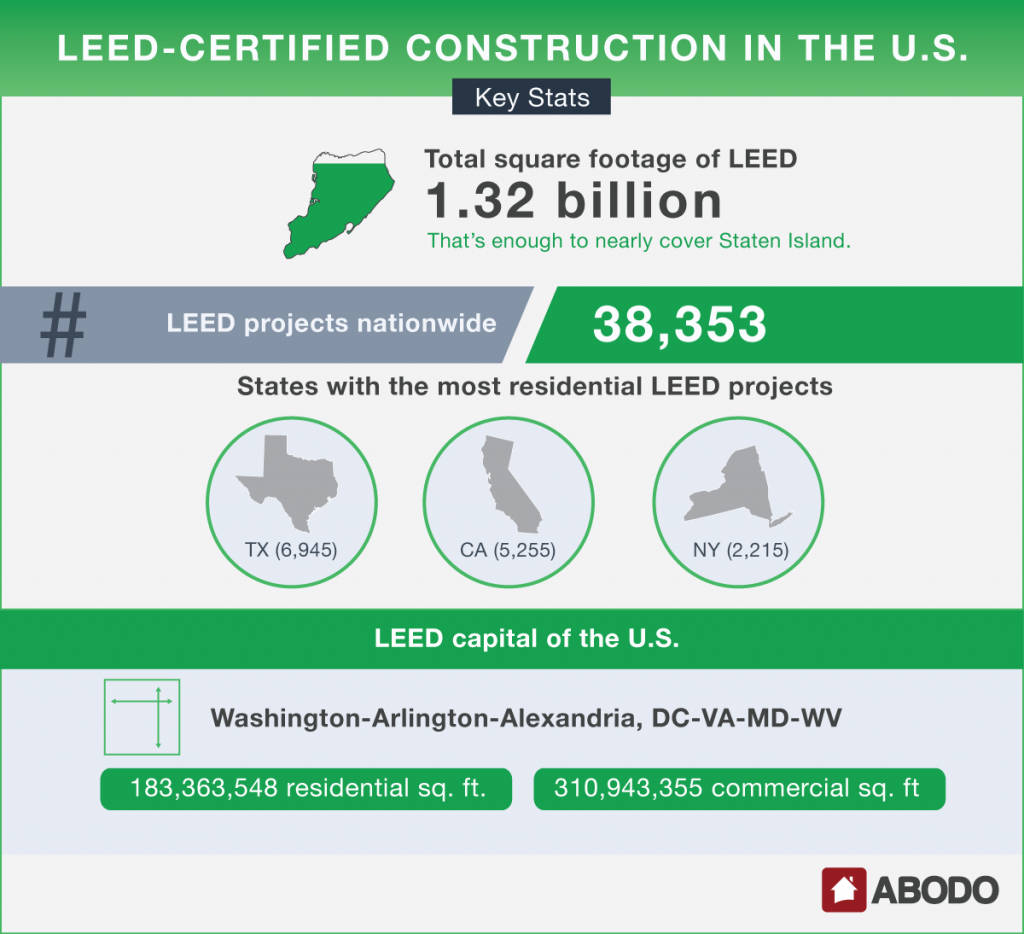
Texas takes the lead for the state with the most LEED-certified residential construction projects by a wide margin. Texas has 6,945 LEED-certified residential projects and more than half of them are in Dallas-Fort Worth-Arlington — which also happens to have the most projects in the nation, at 3,797.
In second place, California has 5,255 projects, thanks largely to Los Angeles-Long Beach-Anaheim with 2,251. New York also ranks highly, with 2,215.
But our LEED Capital of the U.S. actually beats out the state of New York with number of residential projects: 2,675.
Washington-Arlington-Alexandria, DC-VA-MD-WV, gets the title of LEED Capital of the U.S., for both residential and commercial construction. The metro area holds 183,363,548 residential and 310,943,355 commercial sustainable square feet.
GREEN APARTMENTS & HOMES
When it comes to average square footage, two urban areas are head and shoulders above the rest for residential LEED construction: Chicago-Naperville-Elgin, IL-IN-WI, and Boston-Cambridge-Newton, MA-NH.
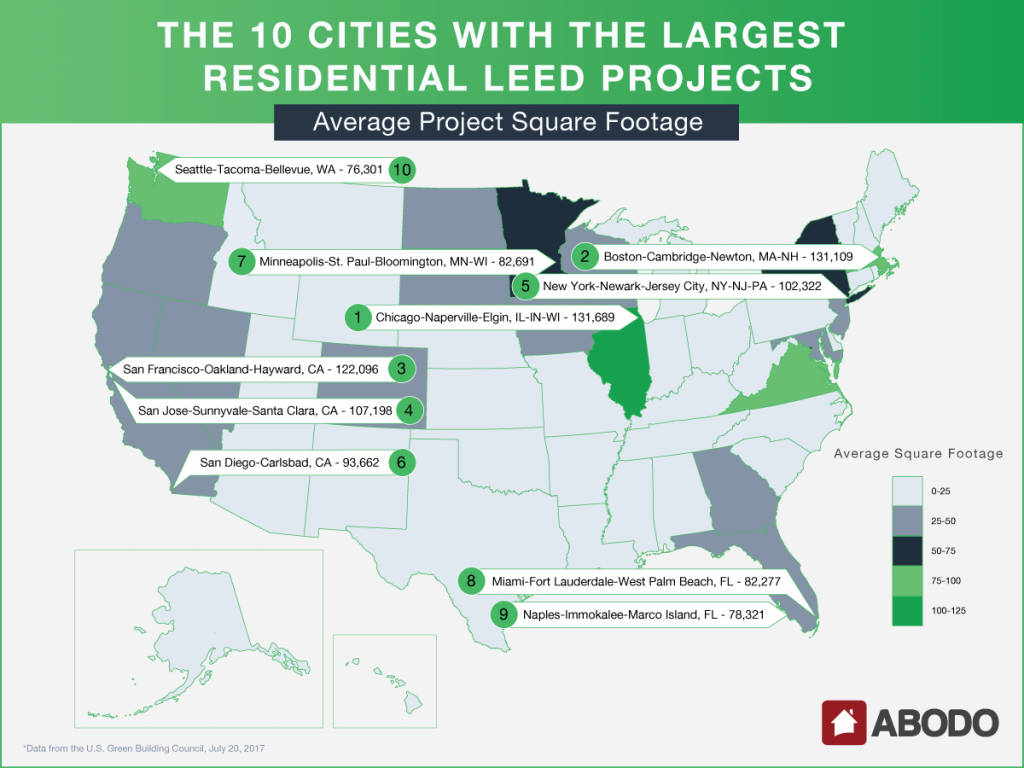
In the Greater Chicago area, the average size of a residential LEED project is 131,689 square feet; Greater Boston is close behind at 131,109. Silicon Valley comes in at the next two spots, with San Francisco-Oakland-Hayward, CA (122,096 square feet), and San Jose-Sunnyvale-Santa Clara, CA (107,198 square feet) bringing up a distant third and fourth. New York-Newark-Jersey City, NY-NJ-PA, rounds out the top five with an average residential LEED project square footage of 102,322.
In every other urban area in the top 10, the average residential LEED-certified building is under 100,000 square feet.
With the exception of Naples-Immokalee-Marco Island, FL, a wealthy vacation enclave where the average LEED project square footage is 78,321, all of the urban areas with the largest residential LEED projects are in densely populated metropolitan areas. In most cases, the average project square footage in these urban areas exceeds the state average.
Often the discrepancy is vast, as in San Francisco-Oakland-Hayward, CA, where the average square footage of residential LEED projects exceeds the state average of 45,091 by almost 77,000 square feet.
In other urban areas, like Chicago-Naperville-Elgin, IL-IN-WI, the difference is more modest. Illinois has the highest average square footage for residential LEED projects in the country, at 109,052.
Only one urban area on this list has an average LEED square footage lower than the average of the state within which it is located: Seattle-Tacoma-Bellevue, WA. At 76,301 square feet, LEED-certified residences there are, on average, about 12,000 square feet smaller than in the rest of Washington.
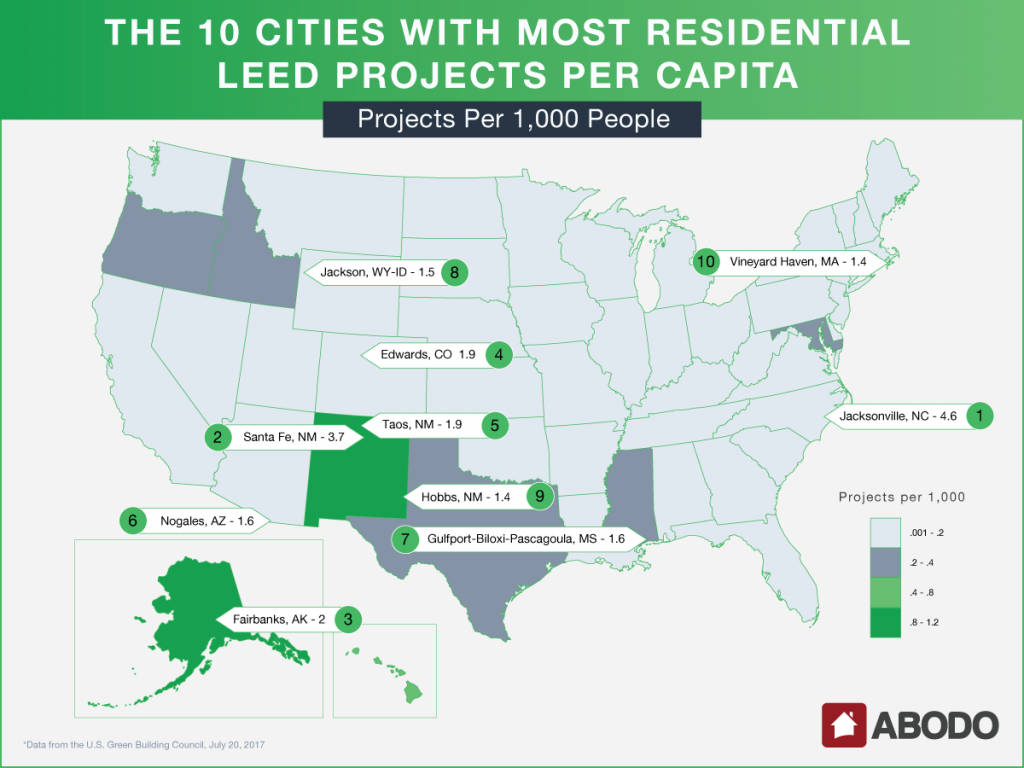
Quantifying green construction by square footage prioritizes densely populated urban areas, which are more likely to support extremely large residential buildings and high-rises. Comparing the number of green construction projects to a city’s population, on the other hand, is perhaps a better indication of just how often LEED construction impacts individual residents’ lives.
The urban areas with the most LEED projects per capita are a significantly smaller bunch. Leading the pack is Jacksonville, NC, with 4.6 residential LEED projects per 1,000 people. Close behind is Santa Fe, NM, where there are 3.7 projects per 1,000, followed by Fairbanks, AK (2 per 1,000), Edwards, CO (1.9 per 1,000), and Taos, NM (1.9 per 1,000).
With the exception of the Martha’s Vineyard community of Vineyard Haven, MA (1.4 per 1,000), all of the top 10 urban areas for residential LEED projects per capita are in the South, Southwest, or West. And the states with the most LEED projects per capita — by a considerably wide margin — are Alaska (0.88 per thousand) and New Mexico (0.87 per thousand).
The next-closest?
Hawaii, where there are 0.5 residential LEED properties for every thousand people.
LEED-CERTIFIED COMMERCIAL BUILDINGS
The metro areas with the most LEED-certified commercial projects should look familiar: Six of them were on our list of metro areas with the largest average residential LEED projects. Massive, densely populated cities dominate the list, with Washington-Arlington-Alexandria, DC-VA-MD-WV (1,886 projects; 310,943,375 square feet), and New York-Newark-Jersey City, NY-NJ-PA (1,672 projects; 306,428,775 square feet), in a class of their own.
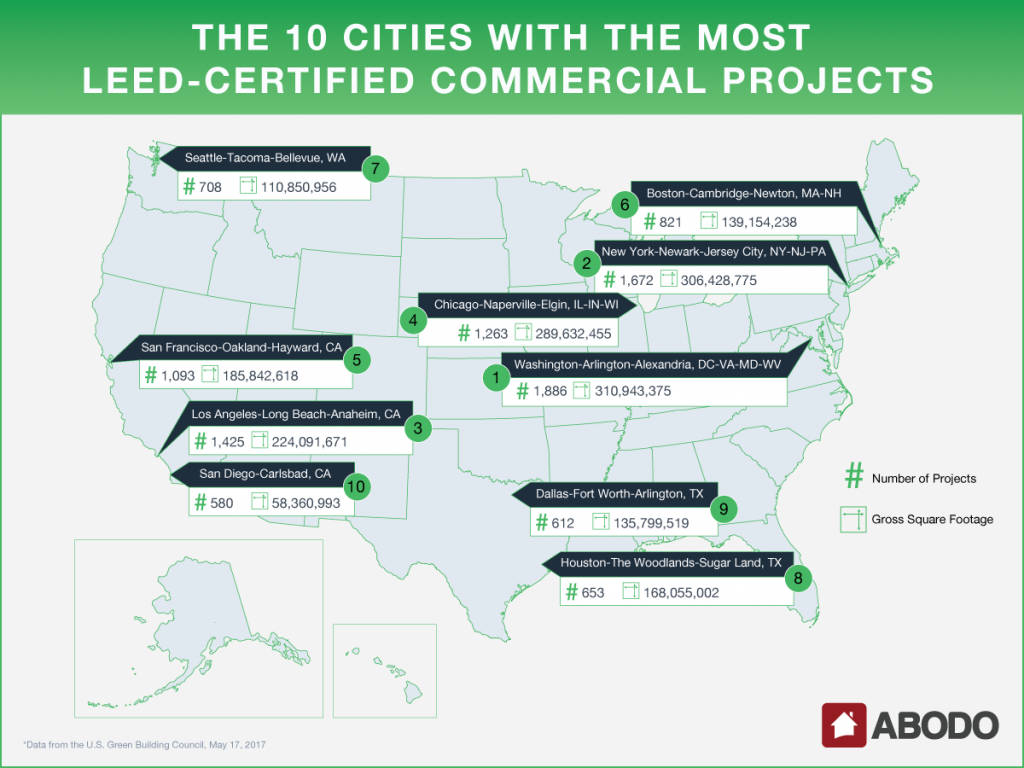
In addition to New York-Newark-Jersey City, holdovers from the urban areas with the largest LEED-certified residential projects are Chicago-Naperville-Elgin, IL-IN-WI (1,263 projects; 289,632,455 square feet); San Francisco-Oakland-Hayward, CA (1,093 projects; 185,842,618 square feet); Boston-Cambridge-Newton, MA-NH (821 projects; 139,154,238 square feet); Seattle-Tacoma-Bellevue, WA (708 projects; 110,850,956 square feet); and San Diego-Carlsbad, CA (580 projects; 58,360,993 square feet).
It seems relatively clear that the cities most poised to undertake major green construction projects are metro areas with extremely robust economies: centers of trade, commerce, and technological development with very high populations and sophisticated economic infrastructure.
Conclusion
Although it’s just one of the ways to manage building sustainability, LEED certifies 2.2 million square feet every day, and comprises more than 5.77 billion square feet in 165 countries around the world, with another 13 billion more square feet still in the works.
Sustainability is a growing trend, and it’s growing hand-in-hand with new residential development. Although large metropolitan areas like New York and and Washington, D.C., have the most certified LEED square footage, smaller areas aren’t being left behind and are staying competitive with projects per capita.
The future looks pretty green.
For press inquiries, please contact Sam Radbil.